

A defensible starting point for most retirees is somewhere between 3% and 4% of your initial portfolio balance, adjusted for inflation each year after that. Whether you sit nearer 3% or nearer 5% depends heavily on your time horizon, asset mix, other income like the Age Pension, and how willing you are to trim spending in a bad year. Treat any single percentage as a starting assumption to stress-test, not a fixed rule, and get your own numbers checked before you commit to a figure.
TL;DR:
- A personalized safe withdrawal rate typically ranges between 3% and 4%, depending on factors like age, asset mix, and income sources such as the Age Pension.
- Changing your horizon, confidence level, or asset allocation can shift your sustainable rate by one percentage point or more, influencing how much you can withdraw initially.
- Flexible withdrawal strategies, such as guardrails or endowment approaches, can support higher starting amounts than the fixed 4% rule if you tolerate cash flow volatility.
- Incorporating guaranteed income sources like annuities or government pensions can significantly lower reliance on market-linked withdrawals.
- Australian-specific factors, including superannuation rules and Age Pension means tests, must be carefully evaluated to avoid overestimating the portfolio's withdrawal capacity.
Table of Contents
- Understanding the safe withdrawal rate and the origin of the 4% rule
- Factors that materially change your personal safe withdrawal rate
- Fixed 4% rule versus flexible withdrawal strategies
- How to estimate your own starting withdrawal rate
- Australia-specific checks that change the calculation
- Amber Wealth's planner perspective on withdrawal rates
- Does retiring earlier or later change the safe number?
- What history actually shows about withdrawal rates in different markets
- Planning for a lifespan you can't predict in advance
- Why spending doesn't stay flat through retirement
- My take on getting this number right
- How Amber Wealth helps you plan a sustainable retirement income
- Selected research and reading
- Sources
- FAQ
Understanding the safe withdrawal rate and the origin of the 4% rule
A safe withdrawal rate is the percentage of your starting retirement portfolio you draw out in year one, then adjust for inflation in every subsequent year, with a stated probability of not running out of money over a defined time horizon. That last part matters more than most people realise. A rate quoted without a horizon or a confidence level is close to meaningless.
The concept traces back to the Trinity study, which backtested a 4% real withdrawal against US market returns from 1926 to 1995 and found it held up across most 30-year periods. That result became known as the 4% rule and has shaped retirement planning conversations for three decades.
The trouble is that Bengen's original work and the Trinity study both relied on one country's market history. Three variables decide whether 4% still applies to you:
- The confidence level you're targeting (90% success looks very different from 75%)
- The number of years your money needs to last
- Your split between growth assets and defensive assets
Change any one of those and the "safe" number moves, sometimes by a full percentage point or more.
Factors that materially change your personal safe withdrawal rate
Your personal number depends on a handful of levers, each one pulling in a specific direction. Time horizon is the biggest: a 90-year-old drawing down over 10 years can sustain a much higher rate than a 60-year-old planning for 35 years of retirement income.
Asset allocation cuts both ways. More shares lift your expected long-run return but increase the odds of a rough sequence early on, which is often more damaging than a rough sequence late in retirement. Inflation, ongoing fees, and tax all quietly erode what a withdrawal actually buys, so a rate that looks fine on paper can underdeliver in real terms.
Sequence-of-returns risk deserves special attention. Two retirees with identical average returns over 30 years can have wildly different outcomes purely because of the order those returns arrived in. A retiree who hits two or three negative years right at the start of retirement, while still drawing income, can permanently damage a portfolio's ability to recover, even if markets rebound strongly afterwards.
Other income sources change the equation too. Age Pension payments, defined benefit pensions, or an annuity reduce how hard your investment portfolio needs to work, which usually allows a higher safe withdrawal rate from the portfolio itself.
Confidence level drives the number more than most people expect. Industry guidance from Charles Schwab suggests targeting a success probability between 75% and 90% depending on risk tolerance, and moving from 90% down to 75% confidence can meaningfully lift the withdrawal rate a plan supports.
- Shorter horizon → higher sustainable rate
- Higher equity allocation → higher expected return, higher volatility
- Bigger cash buffer → lower sequence risk, slightly lower long-run growth
- More guaranteed income → less portfolio pressure
Fixed 4% rule versus flexible withdrawal strategies
The classic approach draws a fixed dollar amount in year one, then increases it with inflation every year regardless of how markets perform. It's predictable and easy to budget around, but it can leave money unspent in good decades or force uncomfortable cuts in bad ones because it never adapts.
Flexible strategies trade some of that certainty for a higher starting number. Morningstar's research shows systems that let spending flex up and down with portfolio performance can support meaningfully higher starting withdrawals than a fixed real approach, provided the retiree can genuinely tolerate a leaner year when markets fall.
Three approaches worth knowing:
- Constant percentage of portfolio. You withdraw a fixed percentage of the current balance each year, so income rises and falls with markets. Nobody runs out of money under this method, but income can be genuinely volatile.
- Guardrails (dynamic) withdrawal. You set upper and lower spending bands and adjust your withdrawal rate when the portfolio drifts outside them, capturing some of the upside of good markets while protecting against extended downturns.
- Endowment-style withdrawal. You calculate spending as a rolling average of the portfolio's value over several years, smoothing out the sharp swings of the constant percentage method.
Layering in guaranteed income changes the whole calculation. Combining Age Pension entitlements, an allocated pension, or an annuity with portfolio withdrawals is a strategy CNBC's coverage of retirement income planning highlights as a practical way to improve reliability, because it means the portfolio itself carries less of the longevity burden.
Pro Tip: If a fixed withdrawal feels too rigid but a fully flexible approach feels too uncertain, a guardrails system with a written trigger point (say, cut spending by 10% if the portfolio falls 20% below plan) gives you a rule to follow instead of a decision to make under stress.
How to estimate your own starting withdrawal rate
Work through this in order rather than jumping straight to a percentage.
- Set your horizon and confidence target. A 30-year horizon at 90% success is conservative; a 20-year horizon or a 75% target allows more room.
- Choose your withdrawal method. Decide whether you want the certainty of fixed real withdrawals or the flexibility of a constant percentage or guardrails approach.
- Map your asset mix and other income. Note your growth versus defensive split, and subtract any Age Pension, annuity, or defined benefit income from what the portfolio needs to cover.
- Check your number against a published benchmark. Morningstar's 2025 research puts a base-case starting rate at 3.9% for a 30-year horizon at 90% success, rising to around 5.7% under flexible methods in some tested scenarios.
That figure assumes no other guaranteed income and a balanced growth/defensive allocation. Add an Age Pension entitlement or annuity income and the portfolio may not need to support the full $39,000 at all, which is where a personalised review earns its keep.
Academic cross-country research tells a more cautious story. A Cambridge Core study spanning 38 developed markets puts the sustainable rate for a 65-year-old couple at a strict 5% ruin tolerance at closer to 2.31%, well below the popular 4% figure.
Australia-specific checks that change the calculation
A few local factors shift the maths before you settle on a number. Age Pension entitlement and the associated means tests can reduce how much income your own portfolio needs to generate, sometimes substantially, depending on your assets and other income.
- Superannuation drawdown rules and the tax treatment of pension-phase income affect what actually lands in your account after tax
- Access to lifetime income products (annuities, some allocated pension features) can lock in a portion of income and reduce reliance on market-linked withdrawals
- Minimum pension drawdown percentages in superannuation may force a withdrawal even in a year you'd rather leave the money invested
- Thresholds, rates, and eligibility rules change periodically, so confirm current figures before acting on them
Interactions between super withdrawal timing and Age Pension eligibility catch a lot of retirees out. Reviewing how super drawdown decisions interact with Age Pension timing before you lock in a withdrawal strategy can prevent an avoidable knock to your entitlements.
Amber Wealth's planner perspective on withdrawal rates
A financial planning firm generally frames success probability as a conversation about trade-offs rather than a single "right" number.
In practice, that usually means holding a real-dollar cash buffer of one to three years, reviewing the plan annually, and rebalancing rather than reacting to headlines. Guaranteed income or a formal Age Pension strategy review often makes sense once the numbers are close to the edge. This is general information, not personal advice, and your own situation deserves its own review.
Does retiring earlier or later change the safe number?
Retirement age is one of the biggest levers on a sustainable withdrawal rate, because it directly sets your time horizon. Someone retiring at 55 might need their portfolio to last 40 years or more, which pushes the safe starting rate down toward the more conservative end of the range. Someone retiring at 67 with a 25 to 28 year horizon has more room, because there are simply fewer years the money needs to stretch across.
It isn't purely linear, either. Retiring earlier usually means a longer accumulation gap before the Age Pension becomes available, which increases pressure on the portfolio in those bridge years. Retiring later, particularly past Age Pension age, can allow a blended approach where government income covers part of essential spending from day one, letting the portfolio carry less weight.
There's also a health and spending dimension. Retirees in their late 60s and 70s often spend more on travel and lifestyle in the earlier "active" years of retirement, then less in their 80s as activity naturally slows, before aged care costs sometimes rise again later. A withdrawal rate calculated as a flat percentage doesn't capture this shape at all, which is why horizon alone shouldn't be the only input into your number. Someone retiring at 60 in good health with a long expected retirement should generally plan more conservatively than someone retiring at 70, even if both have similar portfolio balances.
What history actually shows about withdrawal rates in different markets
Backtesting withdrawal rates against real market history reveals just how much the answer depends on which market and which era you test.
Test the same idea against a broader set of countries and the picture gets less comfortable. The Cambridge Core cross-country study, drawing on 38 developed markets rather than just the United States, found materially lower sustainable rates once you include markets that experienced deeper or longer downturns than the US did over the same stretch.
The gap between those two numbers isn't a contradiction. It reflects a real difference in what each study measured: one country's relatively strong 20th-century run versus a broader, more sobering sample that includes markets battered by war, currency collapse, and extended stagnation. Retirees relying heavily on a single market's history for their plan are implicitly betting that market repeats a favourable pattern. A plan built on a wider, more conservative evidence base tends to hold up better if the next 30 years turn out less kind than the last.
Planning for a lifespan you can't predict in advance
Nobody knows how long they'll live, and that uncertainty, known as longevity risk, is arguably the hardest variable in the whole withdrawal-rate calculation. Plan for too short a horizon and you risk outliving your money. Plan too conservatively for an extremely long horizon and you might under-spend for decades, missing out on experiences you saved for.
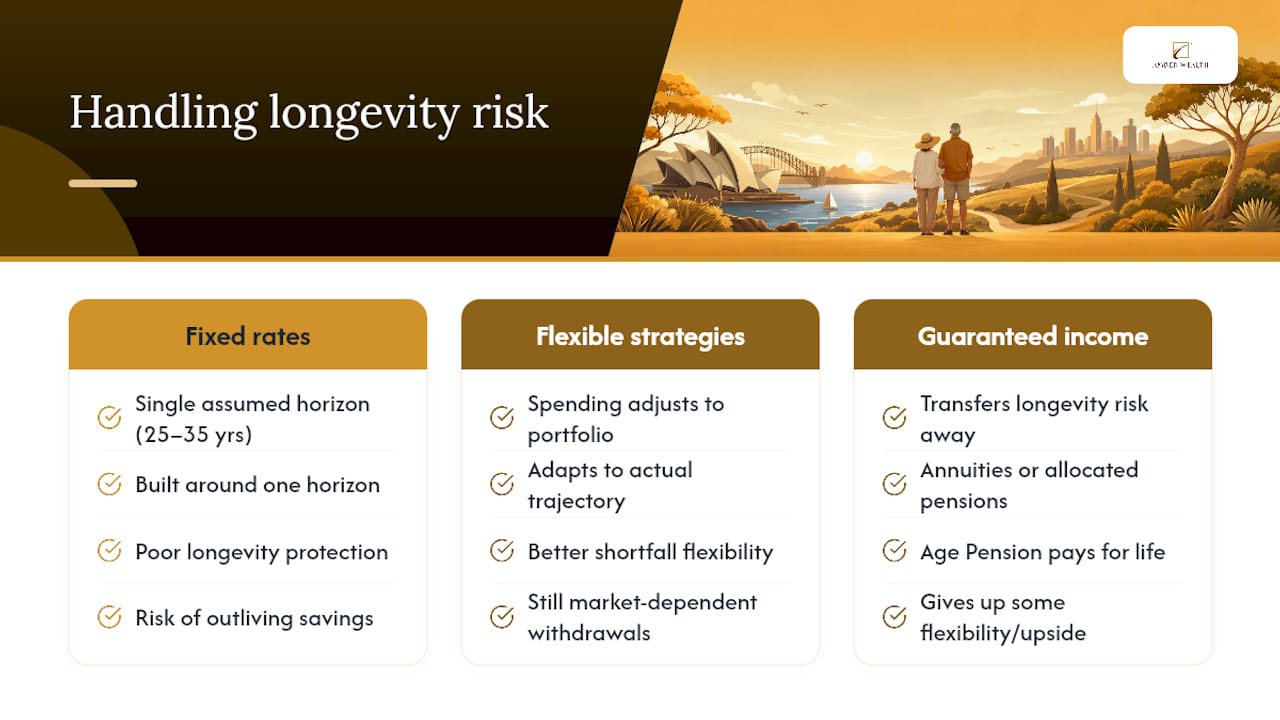
Fixed withdrawal rates handle this poorly because they're built around a single assumed horizon, typically 25 to 35 years. Flexible strategies help by letting spending adjust to a portfolio's actual trajectory rather than a fixed assumption made at retirement. But the more robust answer for genuine longevity protection usually involves shifting part of your income away from market-dependent withdrawals altogether.
This is where guaranteed income products earn their place in a retirement plan. An annuity or an allocated pension with lifetime income features effectively transfers longevity risk to an insurer or the government, in exchange for giving up some flexibility or, with private annuities, some potential upside. The Age Pension itself functions as a form of longevity protection for eligible Australians, since it continues for as long as someone lives regardless of what happens to their personal savings. Blending a portion of guaranteed income with portfolio withdrawals is a practical hedge against the one variable no calculator can pin down. Exploring the range of retirement income strategies available to Australian retirees is a sensible step before finalising how much of your plan to protect this way.
Why spending doesn't stay flat through retirement
Most withdrawal-rate models assume a constant, inflation-adjusted income stream from day one of retirement to the last. Real retiree spending rarely works that way. Research into retirement spending patterns generally describes three loose phases: an active "go-go" phase in the early years with higher discretionary spending on travel and lifestyle, a "slow-go" middle phase where spending naturally tapers as activity reduces, and a "no-go" later phase where discretionary spending falls further but healthcare and aged care costs can rise sharply.
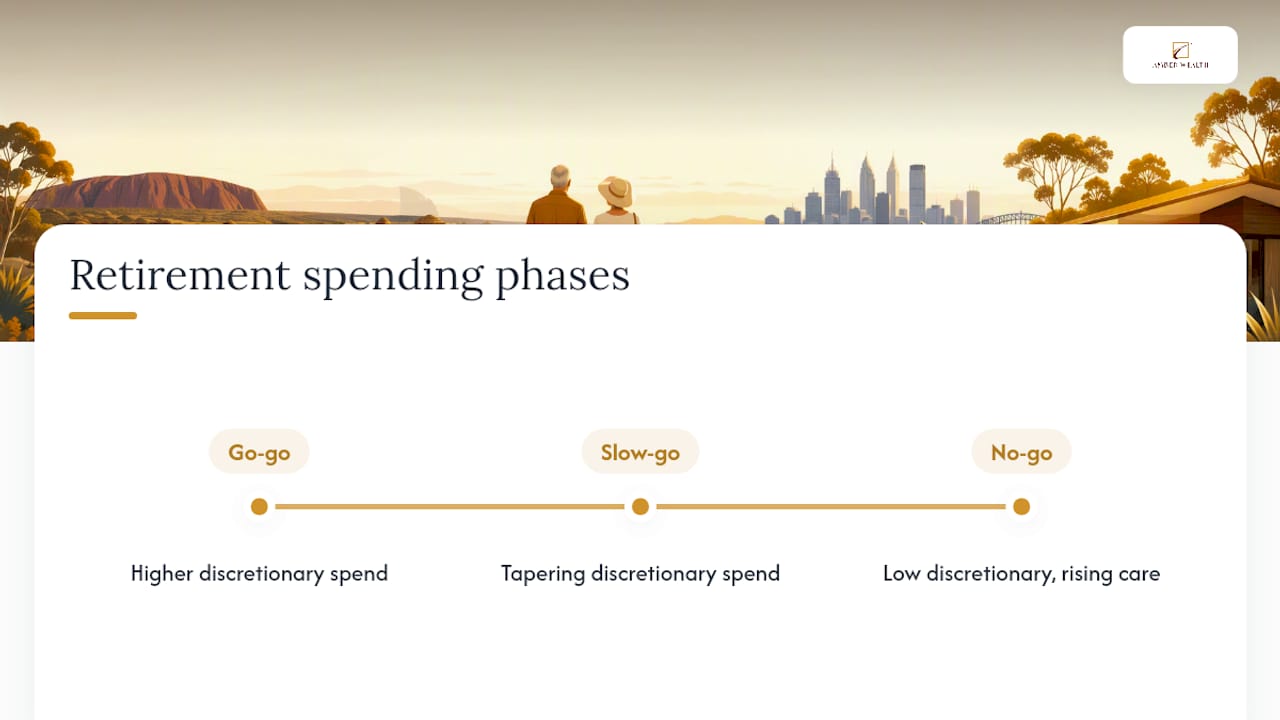
A withdrawal strategy that ignores this shape risks two mistakes. It can either force unnecessary belt-tightening during the years you're most able to enjoy the money, or it can leave a retiree under-provisioned for a spike in aged care or medical costs later on. Some planners address this by front-loading slightly higher withdrawals in the active years and building in a step-down later, rather than a flat inflation-linked amount throughout.
The practical takeaway is that a single safe withdrawal rate is really a starting assumption for year one, not a number that should run unexamined for three decades. Reviewing the plan periodically, and adjusting for how your own spending is actually tracking against those three phases, tends to produce a more realistic and more comfortable outcome than sticking rigidly to a formula calculated at age 60.
My take on getting this number right
Run your own numbers against a benchmark like Morningstar's, stress-test them against a more conservative scenario, and revisit the plan every year rather than setting it once and walking away.
— Adam
How Amber Wealth helps you plan a sustainable retirement income
Working out a personal withdrawal rate involves more moving parts than any single formula can capture, your super balance, Age Pension eligibility, asset allocation, and how your spending is likely to shift over the decades ahead. Amber Wealth's retirement planning service is built specifically around pre-retirees and retirees working through exactly this problem, blending retirement income modelling with Age Pension strategy so the two aren't assessed in isolation.

A first consultation typically covers a review of your current portfolio and super structure, a look at how a proposed withdrawal plan holds up under different market scenarios, and an assessment of how your spending decisions might affect Age Pension entitlements over time. Where superannuation drawdown structure or SMSF strategy needs attention alongside the withdrawal plan, Amber Wealth's superannuation and SMSF advice can be reviewed in the same conversation. If you'd rather work through the fundamentals first, Amber Wealth's retirement planning checklist is a useful starting point, and understanding how your asset mix behaves under stress is easier with a tool like this asset allocation visualisation guide. From there, booking a complimentary consultation with Amber Wealth is a straightforward way to get your own withdrawal-rate assumptions checked against your actual circumstances.
Selected research and reading
Morningstar's retirement-income research provides current starting-rate benchmarks worth checking annually. The Cambridge Core study offers a more conservative, cross-country view worth weighing against US-based figures. CNBC's coverage explains the practical case for blending guaranteed income with withdrawals, and the Trinity study remains essential background for understanding where the 4% figure came from in the first place.
This article is general information, not a substitute for advice from a qualified financial advisor. Consult a qualified financial professional about your own circumstances before acting on anything here.
Sources
- The safe withdrawal rate: evidence from a broad sample of developed markets | Cambridge Core
- Trinity study — Wikipedia
FAQ
Is 5% a safe withdrawal rate?
Morningstar's base case puts a 90% success rate closer to 3.9%, though flexible withdrawal methods can push sustainable starting rates up toward 5.7% in some tested scenarios.
Is 4.7% a safe withdrawal rate?
It's less comfortable for a 30-year horizon at a 90% confidence target, where Morningstar's benchmark sits closer to 3.9%. The right answer depends on your specific horizon and confidence level.
What is Dave Ramsey's 8% rule?
Definitions and figures for this rule vary depending on the source, and it isn't backed by the same peer-reviewed research covered here. Rather than repeat an unverified number, it's worth comparing any high withdrawal figure against the evidence-based benchmarks from Morningstar and the Trinity study before relying on it.
How do I calculate the safe withdrawal rate?
Start by setting your time horizon and target success probability, then choose a withdrawal method (fixed real, constant percentage, or a flexible guardrails approach), and factor in your asset mix and other income like the Age Pension. From there, check your figure against a published benchmark such as Morningstar's 3.9% base case for a 30-year horizon, and consider a personalised review with a financial planner like Amber Wealth to stress-test it against your actual numbers.
Recommended
- SMSF Pension Setup: Australia 2026 Checklist for TBAR, $2M Cap
- Minimum pension drawdown 2026: rates, rules and how to comply
- 1–3 Year Cash Buffer: How Australians Can Manage Sequence of Returns Risk
- Deeming rates 2026: what retirees need to know
This article is general information, not a substitute for advice from a qualified financial advisor. Consult a qualified financial professional about your own circumstances before acting on anything here. General Advice Warning Disclaimer: The information on this website is general information only and is not intended to be a recommendation. We strongly recommend you seek advice from your financial adviser as to whether this information is appropriate to your needs & financial situation.